
Thursday, December 18, 2008
Are there aliens out there?
Wednesday, December 17, 2008
The BIG BANG in picture form
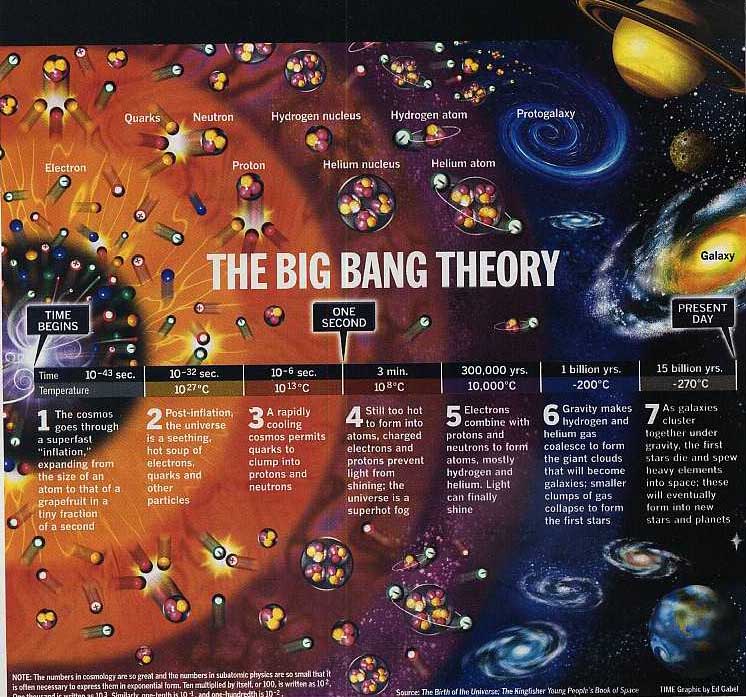 The most common religious belief in Manchester, IA is Christianity. Often, students ask if the Big Bang (science) and religious belief (which is NOT science) can be compatible. The answer, of course, depends on the specific tenets of your belief system. Roman Catholic and many Protestant religions argue that the two are compatible, suggesting one is DATA and one is DIVINELY REVEALED.
Here is the text from Genesis 1. Do you think this is a contradiction, or a support of the Big Bang Theory?
Genesis 1
The Beginning
1 In the beginning God created the heavens and the earth. 2 Now the earth was [a] formless and empty, darkness was over the surface of the deep, and the Spirit of God was hovering over the waters.3 And God said, "Let there be light," and there was light. 4 God saw that the light was good, and He separated the light from the darkness. 5 God called the light "day," and the darkness he called "night." And there was evening, and there was morning—the first day.
6 And God said, "Let there be an expanse between the waters to separate water from water." 7 So God made the expanse and separated the water under the expanse from the water above it. And it was so. 8 God called the expanse "sky." And there was evening, and there was morning—the second day.
9 And God said, "Let the water under the sky be gathered to one place, and let dry ground appear." And it was so. 10 God called the dry ground "land," and the gathered waters he called "seas." And God saw that it was good.
11 Then God said, "Let the land produce vegetation: seed-bearing plants and trees on the land that bear fruit with seed in it, according to their various kinds." And it was so. 12 The land produced vegetation: plants bearing seed according to their kinds and trees bearing fruit with seed in it according to their kinds. And God saw that it was good. 13 And there was evening, and there was morning—the third day.
14 And God said, "Let there be lights in the expanse of the sky to separate the day from the night, and let them serve as signs to mark seasons and days and years, 15 and let them be lights in the expanse of the sky to give light on the earth." And it was so. 16 God made two great lights—the greater light to govern the day and the lesser light to govern the night. He also made the stars. 17 God set them in the expanse of the sky to give light on the earth, 18 to govern the day and the night, and to separate light from darkness. And God saw that it was good. 19 And there was evening, and there was morning—the fourth day.
20 And God said, "Let the water teem with living creatures, and let birds fly above the earth across the expanse of the sky." 21 So God created the great creatures of the sea and every living and moving thing with which the water teems, according to their kinds, and every winged bird according to its kind. And God saw that it was good. 22 God blessed them and said, "Be fruitful and increase in number and fill the water in the seas, and let the birds increase on the earth." 23 And there was evening, and there was morning—the fifth day.
24 And God said, "Let the land produce living creatures according to their kinds: livestock, creatures that move along the ground, and wild animals, each according to its kind." And it was so. 25 God made the wild animals according to their kinds, the livestock according to their kinds, and all the creatures that move along the ground according to their kinds. And God saw that it was good.
26 Then God said, "Let us make man in our image, in our likeness, and let them rule over the fish of the sea and the birds of the air, over the livestock, over all the earth, [b] and over all the creatures that move along the ground."
27 So God created man in his own image,
in the image of God he created him;
male and female he created them.
28 God blessed them and said to them, "Be fruitful and increase in number; fill the earth and subdue it. Rule over the fish of the sea and the birds of the air and over every living creature that moves on the ground."
29 Then God said, "I give you every seed-bearing plant on the face of the whole earth and every tree that has fruit with seed in it. They will be yours for food. 30 And to all the beasts of the earth and all the birds of the air and all the creatures that move on the ground—everything that has the breath of life in it—I give every green plant for food." And it was so.
31 God saw all that he had made, and it was very good. And there was evening, and there was morning—the sixth day.
Monday, December 15, 2008
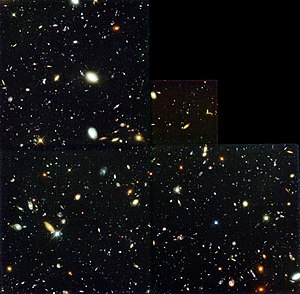
Exploring Hubble Deep Field
Go to the Hubble Galaxy Hunt activity. Take the time you need to explore, but when you are done, I need you to write a 4-6 paragraph reflection on your impressions, including data, statistics, and size factors. Do this on your blog. I will know it is the right post because I want you to link the image that is found here as a picture on your blog.
The video shown in class is below
The video shown in class is below
Wednesday, December 10, 2008
Wednesday, 12/10/2008
I am gone for a family funeral today. Your goal today is to watch the two video clips below (you have to do this in the room, since there are no speakers in the lab), and then to answer some of the questions raised by the third post below. The actual assignment is to make a blog post.
When you get done, you can begin working on the FIVE BEFORE THE FIRST OF THE YEAR post. Note: these are the lab portion of the class, so I cannot guarantee class time to do these. Please see me sometime this week if you have questions.
**mapowell**
When you get done, you can begin working on the FIVE BEFORE THE FIRST OF THE YEAR post. Note: these are the lab portion of the class, so I cannot guarantee class time to do these. Please see me sometime this week if you have questions.
**mapowell**
Distance and the Universe
Yesterday we looked at parallax, and it's ability to help us to measure distances up to about 80 light years away. We we go further away, we need to look for new tools to help us measure the distances. These tools are called Red Shift, Luminosity, and Cepheid variables.
The video below talks about brightness and luminosity in the stellar world. If we have brightness, or luminosity, measured, we can work backwards to find distance. Of course, we have a new wrinkle to work out--what stage of life is the star in, anyway?
The video below talks about brightness and luminosity in the stellar world. If we have brightness, or luminosity, measured, we can work backwards to find distance. Of course, we have a new wrinkle to work out--what stage of life is the star in, anyway?
A video on stellar evolution--low mass and high mass
Please watch this video, and then look at the assignment below.
Stellar Evolution--one picture (20 points)
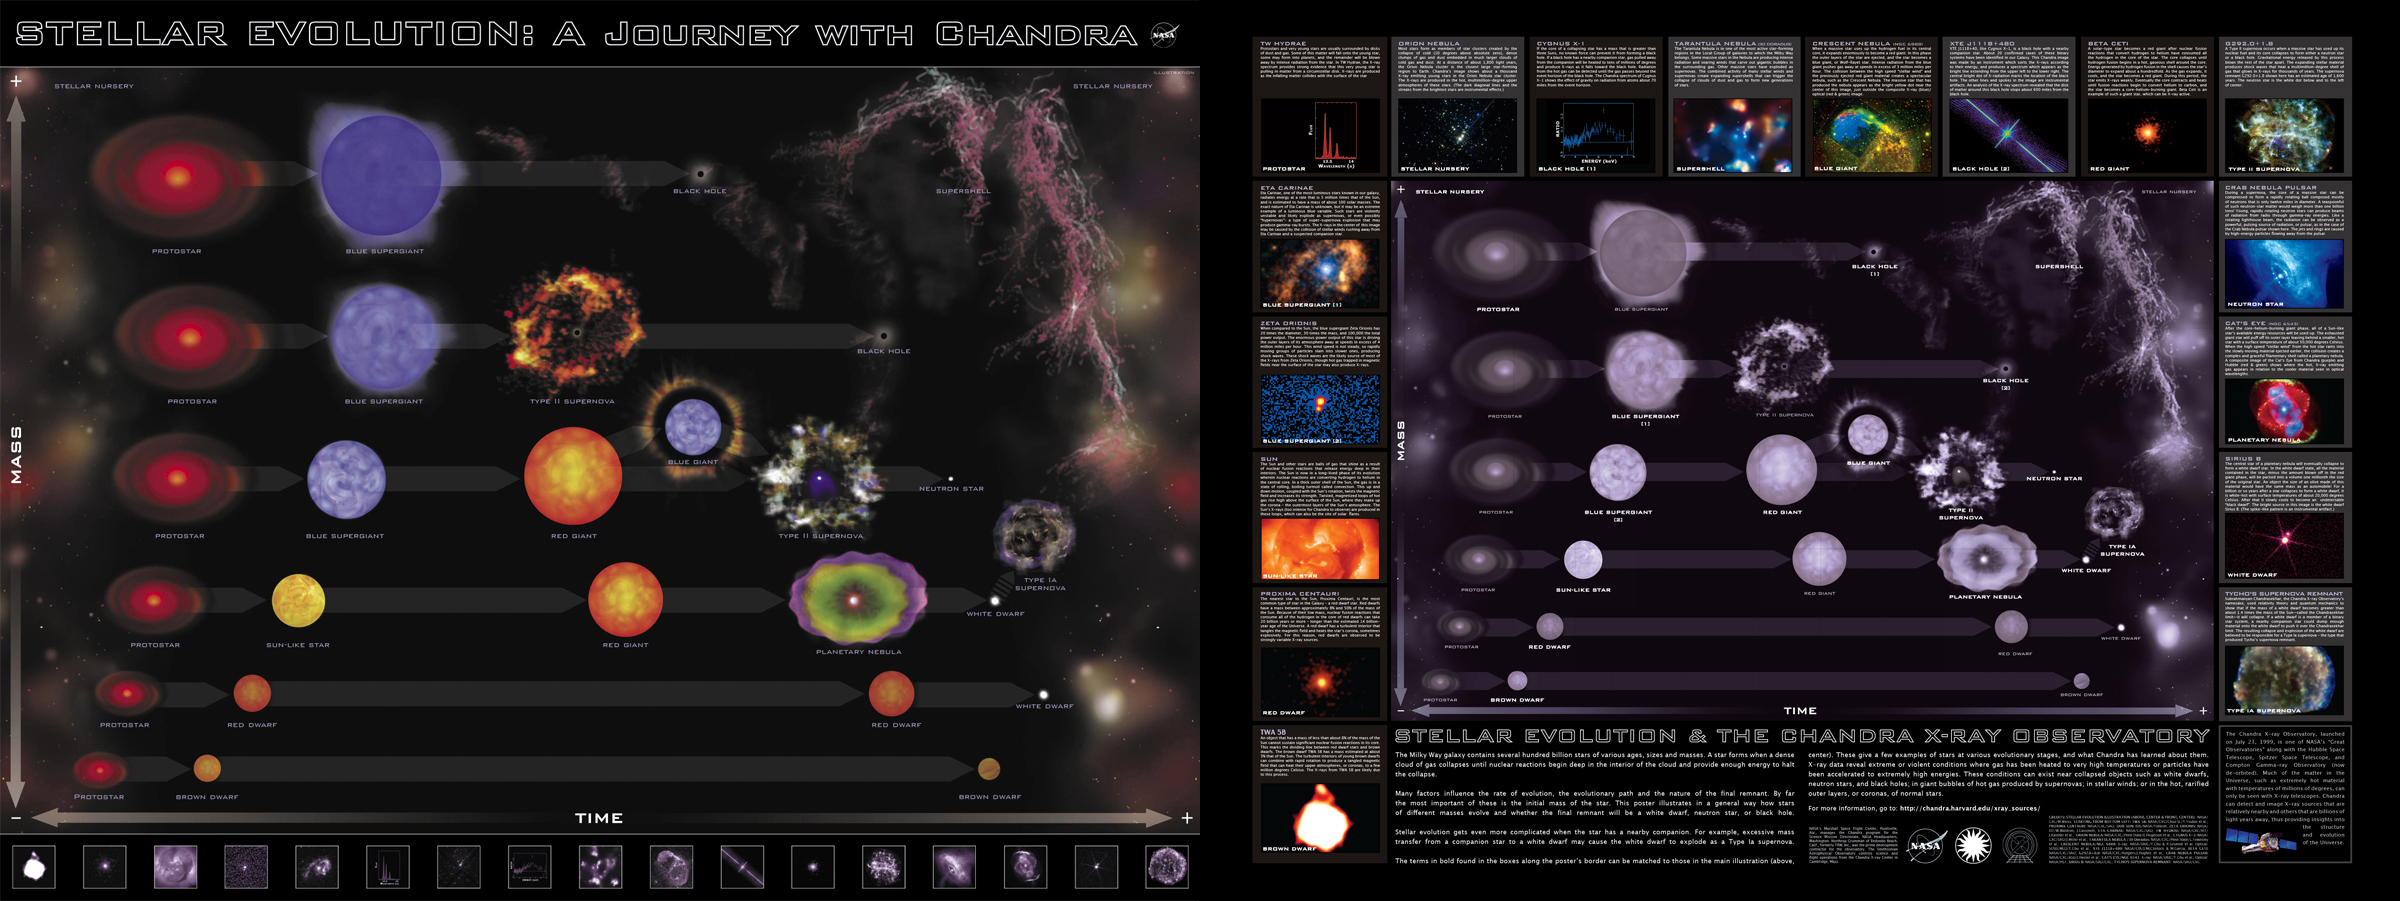
Answer the following questions on your blog for up to 20 points. Also include a paragraph or two about what the two previous videos did to help increase your understanding..
a. Can a white dwarf become a black hole?
b. If time is represented on the horizontal axis, and mass on the vertical axis, what does this tell you about the life cycle of a blue giant star?
c. Can our star, the Sun, form a black hole?
d. What is a red dwarf, from information you can glean from the picture?
e. What do all stars have in common?
Monday, December 8, 2008
FIVE LABS BEFORE THE FIRST OF THE YEAR (1/2 of your lab grade)--100 points
#1 How different mass stars evolve: Pick 5 different masses of stars and watch them evolve into red giant format. For each, record the mass in terms of of a number _____ mass sun and the time it takes to evolve _______ years. If you graph these, do they form a linear or nonlinear relationship? Turn in your graph and your speculations about what this means for stellar evolution
#2 Types of galaxies: Go to Galaxy Zoo and Register. Take the tutorial, and print out the Congratulations sheet when you are finished. At the bottom of the sheet, please summarize the different types of galaxies that are commonly seen in 1-2 paragraphs, or a picture.
#3 Stellar scavenger hunt: Go to the Sloan Digital Sky Survey(SDSS) to see what's out there! SkyServer brings you the entire public database of the Sloan Digital Sky Survey Digital Photos - almost 150 million stars, galaxies, and quasars - free of charge. We use this data to learn science. Download the sheet and fill in. While you may work with a partner, everyone turns in his/her own data. No two groups should have the exact same answers, as there are so many millions of possibilities. Finding a quasar is worth a bonus +4, but it is not required.
#4 Color: Another SDSS work project, but it's a long one. Again, you may work with a partner. Doing the research challenge at the end would be worth a bonus +20 towards your grade
#5 Asteroids: The basics behind finding those potential killers
Friday, December 5, 2008
Test Answers
1. B
2. A
3. C
4. A
5. A
6. B
7. A
8. B
9. C
10. A
11. C
12. C
13. C
14. B
15. C
16. A
17. B
18. B
19. A
20. C
21. So the sun doesn't shrink or blow up
22. "discovered by chance" Prnzias and Wilson- background radiation
23. - Cooler spots on sun
- magnetic
- 2 together can cause a solar flare
24. There's stuff out there, but the solar flares from the sun are usually deflected by the Earth's Van Allen belts
25. Look up Manker diagram on Wikipedia for a good explanation
CCD, or charge coupling devices
Over the years, photography tools have changed. You can see a timeline here. Photos of the universe began to be taken with giant telescopes, and it wasn't until 1975 that the first CCD camera was created. Now, instead of photographs that were 3' x 4', we had the ability to digitally store images.
 Today, we are going to look at that process. Go to here and we'll explore the mechanism behind it all--the photoelectric effect of Albert Einstein.
Wednesday, December 3, 2008
HR Diagrams
1. Go to the HR Diagram tutorial, found here On Friday, you will hand in a concept map, outline, picture, or something that shows me what you have learned. This will be worth 15 points. If you wish, you can use words to connect the bubbles, or if you use outline form, you can define the terms. Be sure to do the 17 interactive questions in the interactive tutorial.
2. Finish your review sheet and check with others. Txt me with any questions you have at FIVE SIX THREE SIX OH EIGHT NINETEEN HUNDRED
3. More of a visual learner? Try looking at this video in the room:
4. CCDs will be the topic of the day on Friday, after the test. You can find out more information here
Tuesday, November 25, 2008
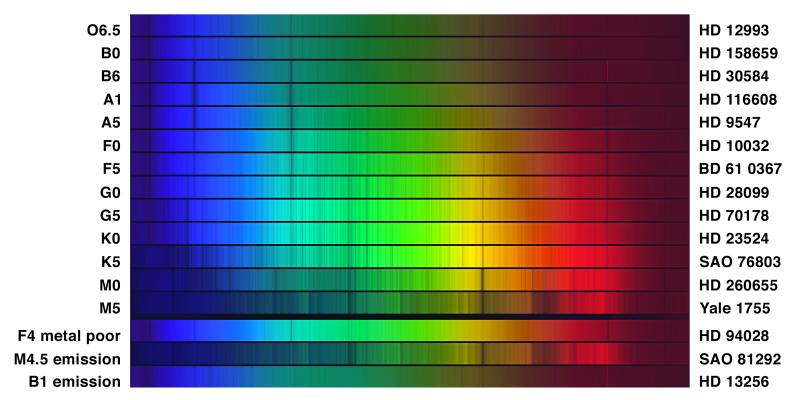
Stellar Spectra Lab--20 points
Today, we will do the lab found here
Gather the stellar spectra of 5 stars and then classify into the OBAFGKM matrix. Hand in your data.
Gather the stellar spectra of 5 stars and then classify into the OBAFGKM matrix. Hand in your data.
Annie Cannon and her spectra -10 pts
Imagine you have one task to which you spend your ENTIRE life in dedication. What would you do? Annie Cannon chose to spend her life studying spectra, and a biography appears here
Your blog post today tells me of your biggest dream or passion at this point in your life....who knows, maybe you will be remembered for more than 400000 contributions, as she was...
Monday, November 24, 2008
THREE LABS BEFORE THANKSGIVING BREAK--60 points
The following activities are to be done before you leave for Christmas break.
#1 SOLAR ASTRONOMY
Click on “blackbody spectrum” in the simulations library. The curve in the simulator represents the amount of light (or flux), emitted versus the wavelength of light for an object of a given temperature. The horizontal axis gives the wavelength of light in nanometers.
Use the slider to try different temperatures of your choice and observe how these changes affect the continuous spectrum. In particular, try the solar temperature: 5800K. Note that you can vary both the horizontal and vertical scale. Try to demonstrate Wien's Law and show why hot stars appear predominantly blue while cool stars seem red. Also demonstrate the Stefan-Boltzmann Law to show that the total energy emitted by a hot object increases at a much faster rate than its temperature. Describe your best simulations and your interpretations on a blog post.
#2 SOLAR SCAVENGER HUNT--20 POINTS
Helpful video found here
Go to the Stanford Solar Center, print the sheet, and fill it in.
#3 Black Holes
Go to the Black Hole site and explore. When you get done, make a blog post that does the following:
1. Distinguishes between an event horizon and an accretion zone of a black hole.
2. Defines escape velocity, black hole, and the speed of light.
3. Explains the relationship between escape velocity, black hole, and the speed of light.
4. Identifies more than one single type of black hole.
5. List evidence that our understanding of black holes has changed.
6. Explain how Hubble Space Telescope's component cameras assist in the search for black holes.
7. List at least 2 myths about black holes that are discredited.
Tuesday, November 18, 2008
Wednesday, 11/19/08--Learning the Proton Rap -20 points

Create a product of some sort that allows me to check your knowledge. This can be a poem, a video on your cell phone, a song, a gcast.com (go ahead, go there, and check it out), or a creative story telling the adventures of hydrogen man/woman. This is due at the beginning of class on Friday. You may have ONE partner, if you choose
Monday, November 17, 2008
The Ghost Particle...
Today, you will be watching the Ghost particle. After each section, you will answer the two questions provided by the teacher...
1. What is a neutrino and how was it first proposed?
2. Give other examples of things you can't see but you know from evidence exist.
3. What does radioactivity have to do with the sun??
4. What did John Bahcall do?
5. Ray Davis was trying to create an experiment where neutrinos changed chlorine to argon atoms. Where was his setup located.
6. What was the problem happening with his experiment?
7. How many flavors of neutrinos are there?
8. How did neutrino oscillation vindicate the work of Ray Davis?
9.What is the Sudbury mine and where is it located?
10. What does it do for Ray and John's experiment?
11. Why did John Bahcall feel like dancing?
12. What is your passion? What would you be willing to spend 30 years studying, even if it meant that other people didn't believe your viewpoint was right?
Friday, November 14, 2008
Escape from the Sun...

Login and turn the layers ON for at least one trial for each Part.
Part A: Run the flow situation for a photon. Record the data in terms of # of layers vs. interactions. Collect data for 5, 10, 15, 20, and 25 layers
As the number of layers increases, what happens to the number of interactions? Is this a linear relationship, or an exponential relationship? How do you know?
Part B: Run the flow situation for a diffusion, and record the data as you did in Part A.
How did the data change when we had larger numbers of photons? Is this data more accurate or less accurate than that collected in Part A? Why do you think so?
Part C: Run the EXPERIMENT. The red cylinder represents the atmosphere, the line drawing at the right represents your eye, and the light at the left represents a photon leaving the light source.
Collect data for photons at 1.5 eV, 1.8 eV, 2.0 eV, 2.3 eV and 2.5 eV. Notice as you adjust the energy, you also adjust the wavelength.
Create a table as follows:
Energy (ev) Wavelength (nm) Photons sent Photons detected
As the energy of a photon increases, what happens to its wavelength? As the energy of a photon increases, what pattern is present for the number of photons detected? Why?
Part D: Run the EXPERIMENT again, but this time, set the photon energy level at 2.2 eV, and change the gas the element is traveling through.
This time, your table should look like this:
Energy (eV) Wavelength (nm) Gas Atoms Photons Sent Photons Detected
What effect do the different types of gas atoms have on the # of photons detected? What would this have to do with a line spectra? If you changed the energy of the photons and ran the experiment again and again, do you think you would continually get the same patterns? Why or why not?
This lab/class activity is due as a post on your blog on 9/24/2008.
Thursday, November 13, 2008
It's the End of the World as We Know it.....or not
Read the article found at universetoday.com and see what you think about the 2012 Doomsday prophecies...
Blog about the possibility of killer solar flares after you read. Thanks!
You also may want to bookmark spaceweather.com, space.com and Soho as you try to 'safely' see the Sun.
Blog about the possibility of killer solar flares after you read. Thanks!
You also may want to bookmark spaceweather.com, space.com and Soho as you try to 'safely' see the Sun.
Wednesday, November 12, 2008
Spaceweather and Asteroids...15 points

Go to Spaceweather and explore the site to check out solar weather, auroras, and Near Earth Objects. Do you think that we should spend a lot of time worrying about asteroids, given the technology we have to detect them? Consider Tunguska, Shoemaker-Levy 9, and the asteroid belt in your blog post, and use specific examples. The post should be 2-3 paragraphs. Blogs will be graded on Saturday, 11/15, and this will be the last post I will grade for the period.
Tuesday, November 11, 2008
The world of Plate tectonics..using playdoh modeling....15 points
Find out about the layers of the earth by examination of the layers here
In class, we created a model of a divergent, convergent, and transverse (or transform or strike-slip faults, depending on the book) using a layered model of playdoh.
Now, use a blog post and answer the following:
1. What is the importance of each of the following terms...
a) Pangaea
b) Sea floor spreading
c) Plate boundaries
d) the ring of fire (Hawaii to Japan)
e) a mid-ocean ridge
f) a shifting north and south pole
2. What do volcanoes on the Moon and Mars tell us about those planets?
3. Go to the GPS time series and find out the motion rates for the following locations:
DUBO
HILO
KELY
HOFN
What does this tell you about the movement of the continents?
4. Find out about the devastating tsunami after Christmas in 2004 by going here. What effects did this have on the rotation of the Earth, the shape of the Earth, the shape of the ocean where it originated, and the energy released by the earthquake.
5. Wegener and his theory of plate tectonics was not accepted until after he died. What are three pieces of evidence for the idea?
Monday, November 10, 2008
The moons of Jupiter Lab-20 points
Today we will be doing a simulation lab in a group. You will need the lab Revolutions of the Moons of Jupiter, found on your computer or here
Run the simulation for the four moons of Jupiter for 30 days. We will print the data attained in a graph format.
After class discussion, you need to put a 2 paragraph reflection on your blog, discussing:
a) the periods of the four moons
b) the graphical pictures attained
c) the difficulty Galileo must have had with a 10x telescope
d) why the 'mini-system' Galileo saw influenced his heliocentric viewpoint.
Thursday, November 6, 2008
All the pieces of the total...20 points

Pick one of the following: Mercury, Venus, Mars, the asteroid belt, Jupiter, Saturn, Uranus, Neptune, Pluto, the Oort Cloud, the Kuiper belt, comets, or killer asteroids. Find a video in English from unitedstreaming.com or Youtube and embed it in your blog. Summarize the video, and provide information about the size of the object(s) in comparison to Earth (8000 mi/diameter), its distance to the Sun, space exploration efforts, weight on this object in comparison to Earth (if you can find it), and material composition (metal, water, rock, etc.). You may wish to Google "Your weight on other worlds" or go to 9 Planets for more help
Wednesday, November 5, 2008
Wednesday, 11/5/08
TEST POSTPONED TO FRIDAY. STUDY, in particular, the astronomy contributions of Aristotle, Hipparchus, Ptolemy, Copernicus, Brahe, Kepler, Newton, Galileo.
Today, we start our study of the solar system. To do this, we need to understand gravity and Kepler's laws. Print a copy of the documents found here and here
You will be going to the simulation found here.
=====
When you get done, please watch the video clip and then make a post on your blog about your impressions of the lab and the size of the planets. A blog post is usually 4-6 sentences as a minimum.
Thursday, October 30, 2008
#stars in the Night sky...25 points

Go outside one night in the two days, and use a toilet paper tube as your viewfinder. Point your viewfinder towards three different constellations in the sky if you want(use your starmap or stellarium to identify them). Look through the viewfinder and count the number of stars you see. Text me what you see at
Part of the Sky # of Stars I Saw
1.
2.
3.
# lights w/in 100 yards
Now, take an average of those three counts, and multiply by 100. This gives you the number of stars you can see in the sky on an average night.
=======
How does this work? Well, the average tube is about 11.5 cm long, and about 2.3 cm across. If we calculated the Surface Area of a sphere that was made entirely of toilet paper tubes (4 pi * r^2=1667 cm^2
If we figure each tube is about 2.3 cm across, the Area of the tube is about pi*2.3^2= cm^2=16.7 cm^2. 1667/16.7 = about 100 tubes to view the entire night sky... assuming you have the same type of toilet paper I do.
=======
So, do you expect everyone in the class to get the same number of stars according to a range of say, +/- 100? Yes or no? Explain your rationale.
Due Date 11/3
Monday, October 27, 2008
History of the Universe
History and the Universe (25 pts)
Scale the Solar System
Compile the following information into a project that reflects your understanding of the history of astronomy. This can be a series of powerpoint slides, a music video/rap, a vlog, a youtube video, or a series of blog posts.
ASTRONOMERS:
For each astronomer: Include the years of their birth/death dates and a picture. Hint: Google Images will be especially helpful with this.
For each astronomer: Include one or two relevant contributions in astronomy (um, Galileo has FIVE), as well as the approximate year of those discoveries. Note if the information is from your book or a website Also note that this is a survey of astronomers; as a result, not all information will be found in your book.
Slide sorter: Use the slide sorter on Powerpoint to put the astronomers into order chronologically
Resources:
Use the classroom book, Chapters 1 and 2, the index, and especially the links on pp 39 and pp. 57. While the pictures do not need to be referenced, the source for each astronomer MUST be listed at the bottom of each page.
Note: WIKIPEDIA is NOT a valid reference that can be listed. Neither is Google.com. They are starting points for future reference.
Due Date: 10/31/2008
Scale the Solar System
Compile the following information into a project that reflects your understanding of the history of astronomy. This can be a series of powerpoint slides, a music video/rap, a vlog, a youtube video, or a series of blog posts.
ASTRONOMERS:
- Aristotle,
- Hipparchus,
- Ptolemy,
- Carl Sagan,
- Stephen Hawking,
- Pope Gregory XIII,
- Albert Michelson (Michelson-Morley experiment),
- James Van Allen,
- Henrietta Leavitt,
- Copernicus,
- Tycho Brahe,
- Galileo Galilei,
- Isaac Newton,
- Edwin Hubble,
- Albert Einstein,
- Johannes Kepler,
- Clyde Tombaugh,
- Annie Cannon,
- Arno Penzias/Robert Wilson,
- S. Chandrasekhar,
- Ray Davis/John Bahcall
For each astronomer: Include the years of their birth/death dates and a picture. Hint: Google Images will be especially helpful with this.
For each astronomer: Include one or two relevant contributions in astronomy (um, Galileo has FIVE), as well as the approximate year of those discoveries. Note if the information is from your book or a website Also note that this is a survey of astronomers; as a result, not all information will be found in your book.
Slide sorter: Use the slide sorter on Powerpoint to put the astronomers into order chronologically
Resources:
Use the classroom book, Chapters 1 and 2, the index, and especially the links on pp 39 and pp. 57. While the pictures do not need to be referenced, the source for each astronomer MUST be listed at the bottom of each page.
Note: WIKIPEDIA is NOT a valid reference that can be listed. Neither is Google.com. They are starting points for future reference.
Due Date: 10/31/2008
Subscribe to:
Comments (Atom)